Hurricanes and Sea Surface Temperature
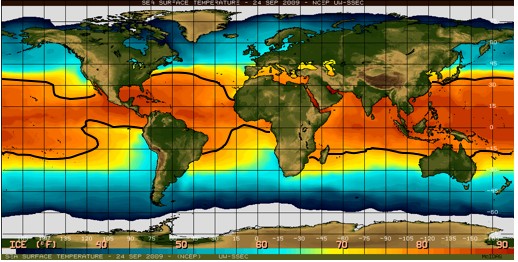 |
Sea Surface Temperature (SST) image for the global ocean, based on data gathered on September 24, 2009. Blue and green colors indicate cooler waters (less than 15.6°C [60°F]) while orange and red colors, outlined by the black curves, indicate warmer waters (at least 26.5°C [~80°F]). (Image courtesy of the Space Science and Engineering Center, University of Wisconsin-Madison.) |
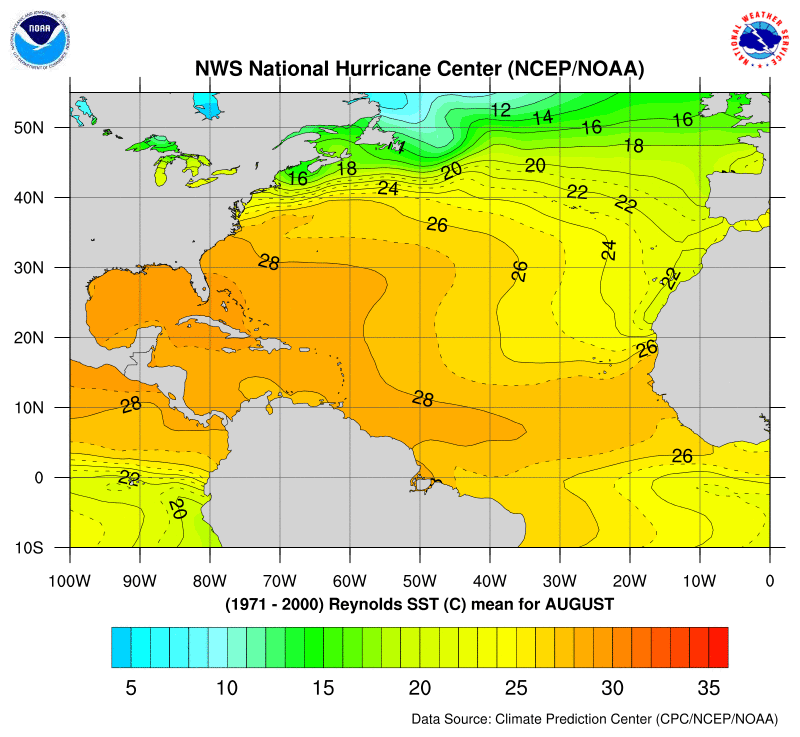
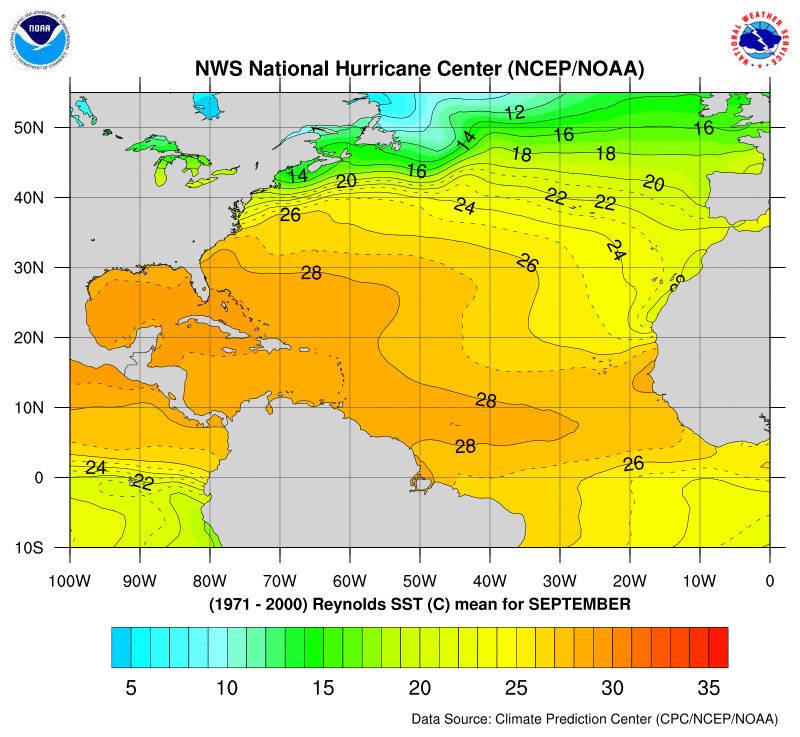
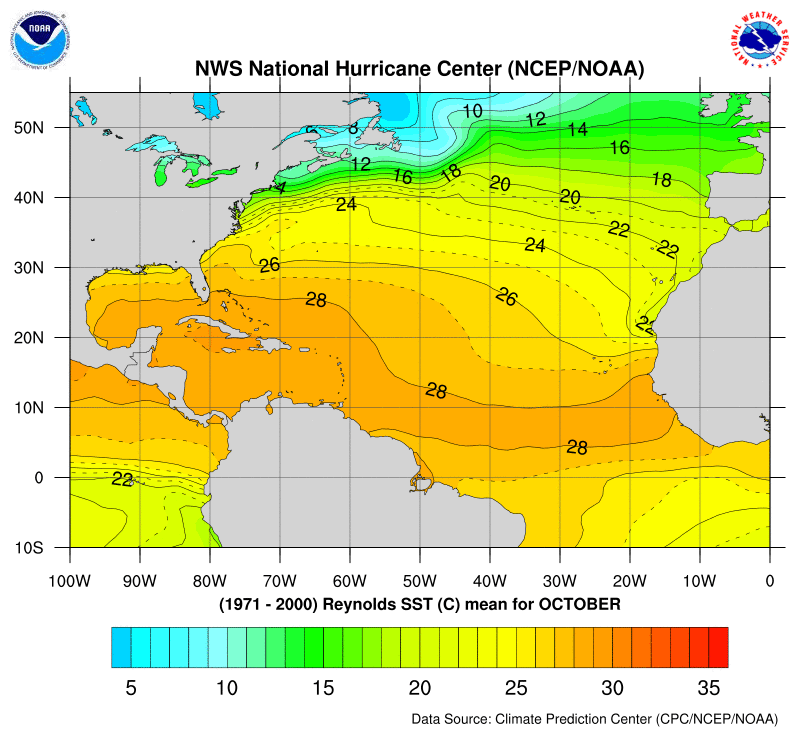
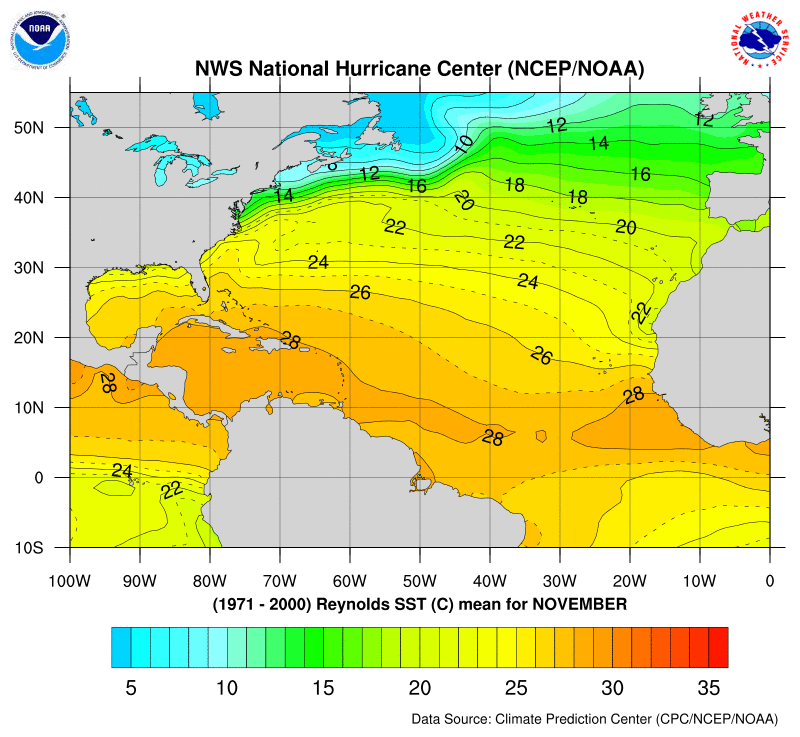
Sea Surface Temperature and Hurricane Development Analysis
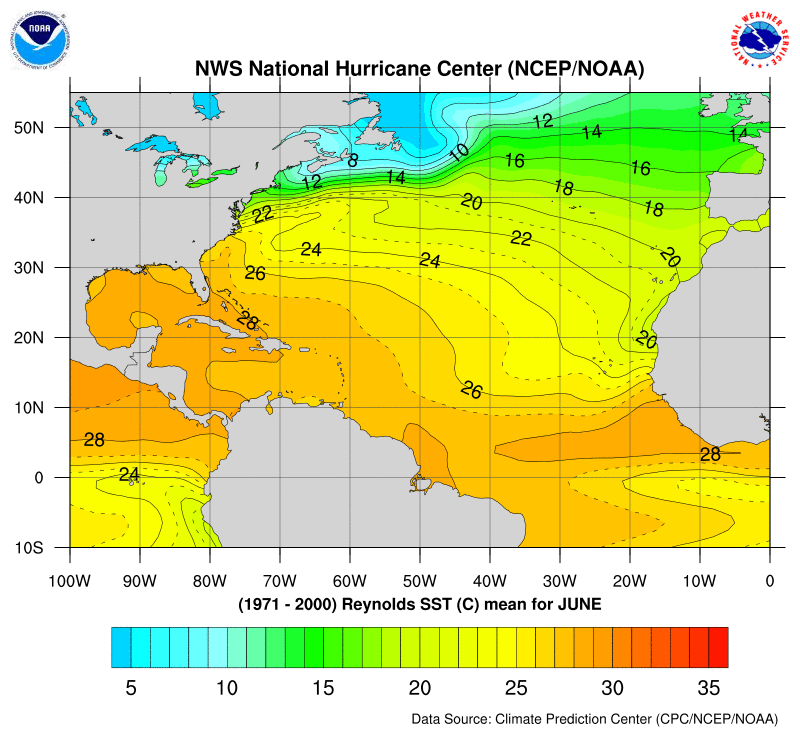
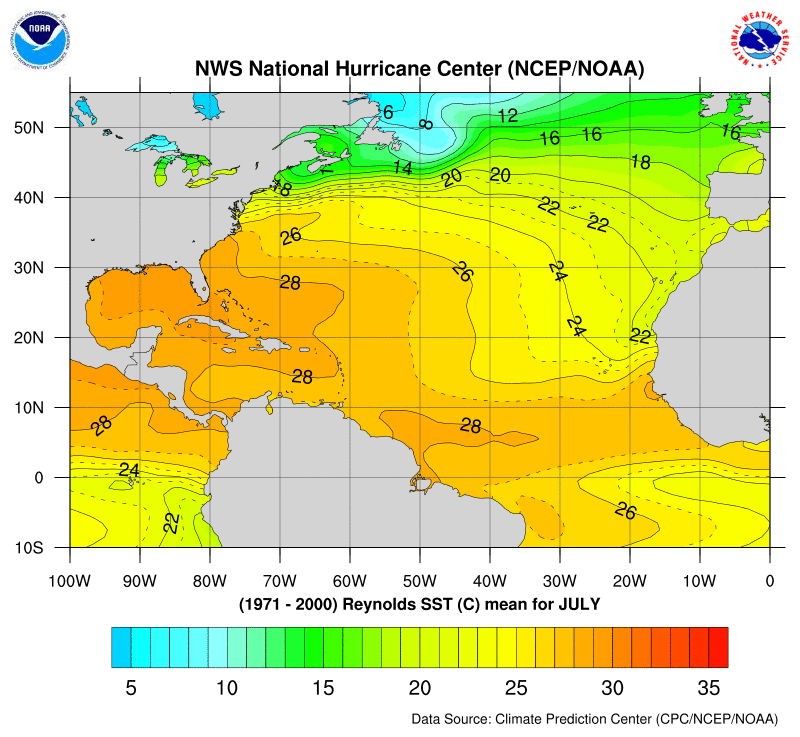
The pictures below are average sea surface temperature for the years 1971-2000 during the North Atlantic hurricane season. Examine the sea surface graphics, noting the month and body of water, Atlantic Ocean and Gulf of Mexico.
http://www.nhc.noaa.gov/sst/ Monthly Mean Climatology Fields (1971-2000)
|
|
June |
July |
|
|
August |
September |
|
|
October |
November |
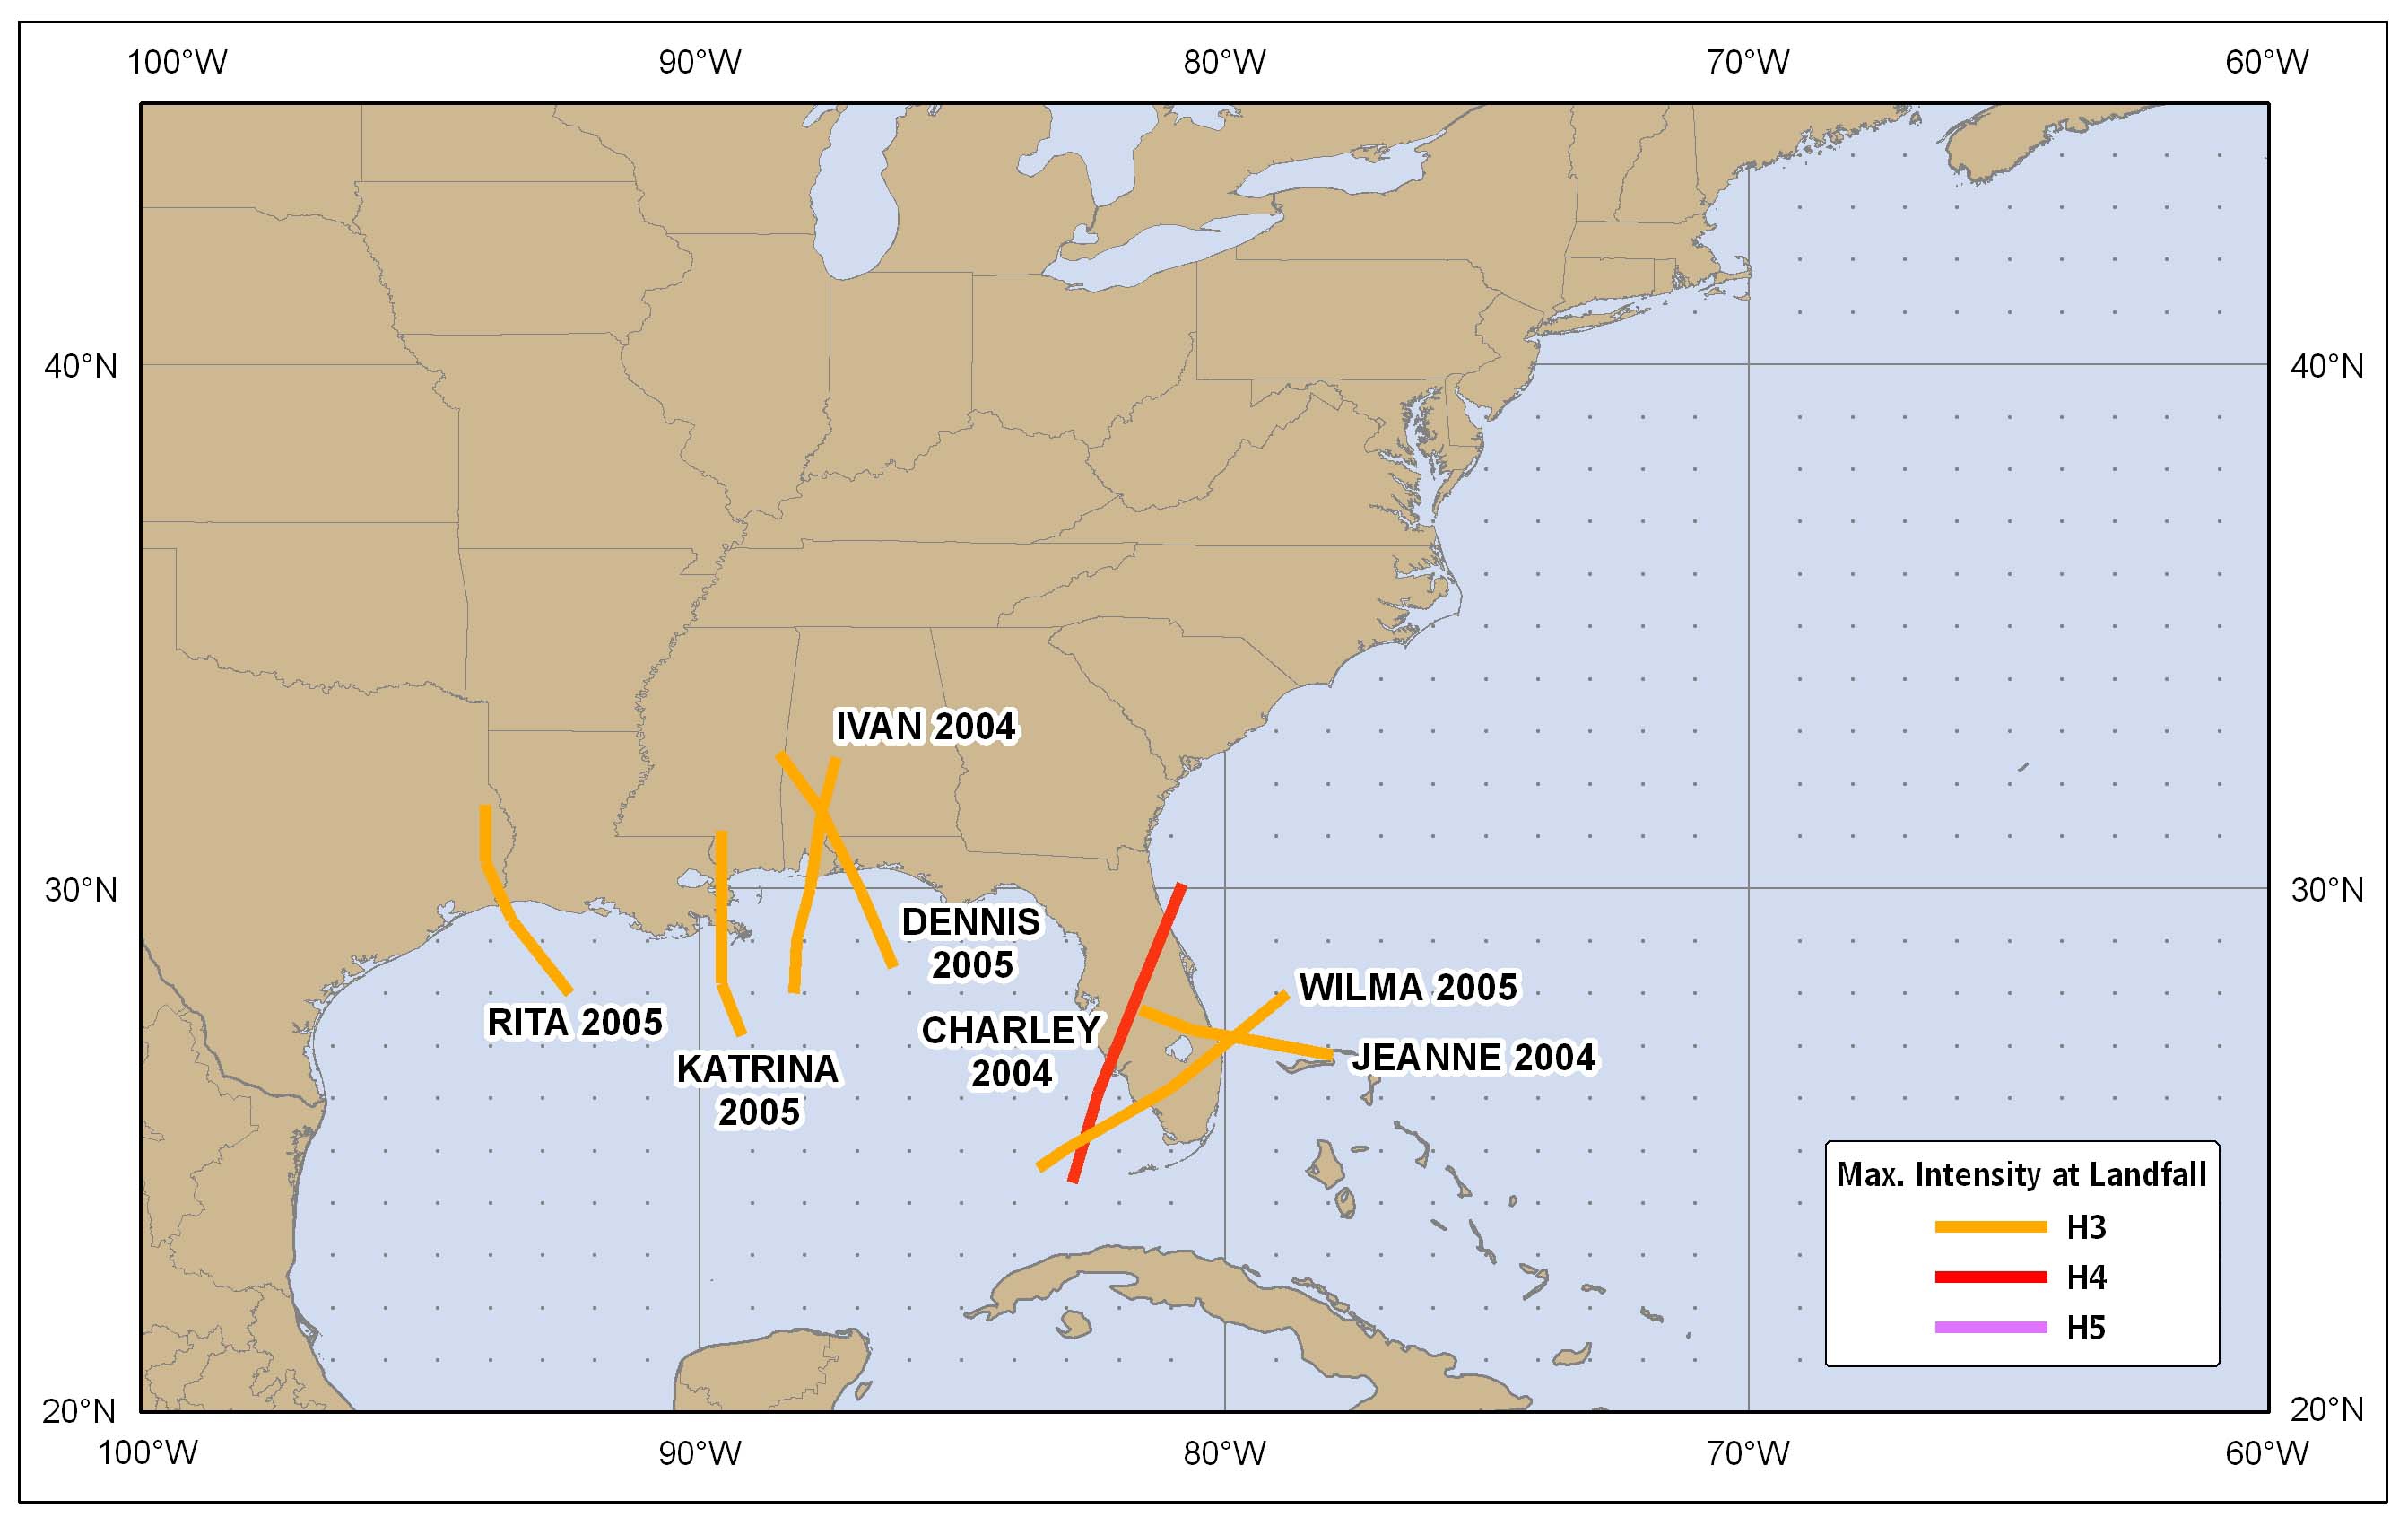
US Hurricane Strikes with Intensity by Year

http://www.nhc.noaa.gov/data/images/tracks/majors_2001_2010.jpg
Cold Sea Surface Temperature Wake Left by Hurricane Igor in 2010
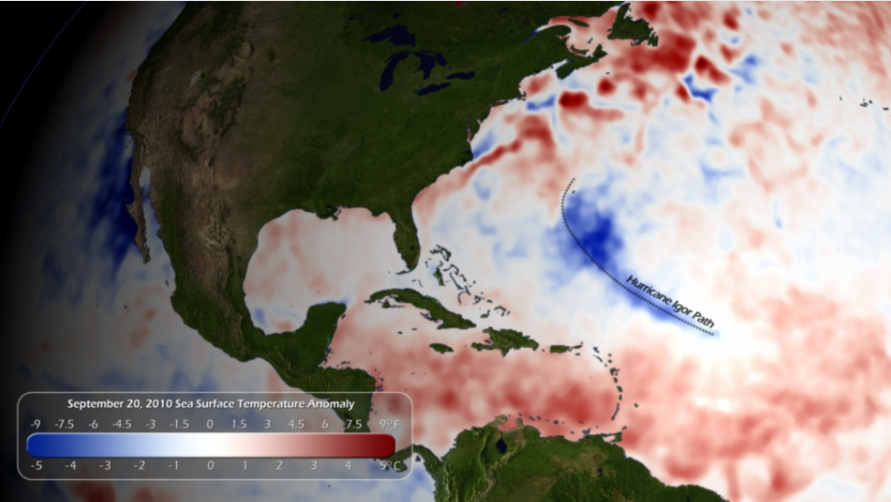
Image Courtesy: National Oceanic and Atmospheric Administration